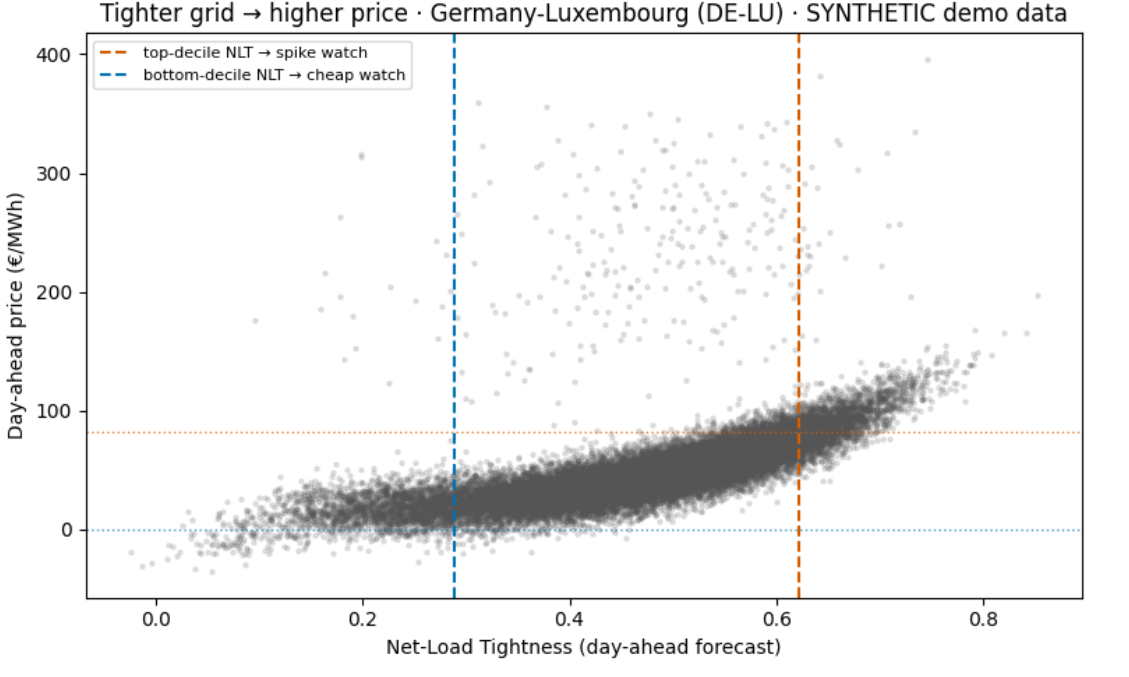
Hi all, I’ve been playing with a small, reproducible signal for the German (DE-LU) day-ahead market and wanted to share it and get the community’s read, especially on the ENTSO-E data side.
The idea is one line of merit-order economics: net load = forecast demand minus forecast wind and solar, divided by available dispatchable capacity, giving a unitless “tightness”. Bottom decile tends to coincide with low or negative prices; top decile with spikes. All inputs are day-ahead forecasts, so it’s knowable before the market clears.
Backtested walk-forward (thresholds fit on past folds only), 26,300 hours, Dec 2022 to Dec 2025:
| Signal |
Precision when it fires |
Base rate |
Lift |
| Spike-risk (top-decile NLT) |
57.5% |
7.8% |
7.4x |
| Cheap / negative (bottom-decile NLT) |
44.7% |
6.3% |
7.1x |
The cheap/negative flag catches about 92% of all negative-price hours.
Notebook (runs on synthetic data with no token, or on real data with a free ENTSO-E token) and code:
Two things I’d genuinely value feedback on:
-
available_dispatchable is currently just installed non-intermittent capacity. In your experience, is it worth the work to net out real generation-unit outages, or does installed capacity capture enough?
-
For those who hit the ENTSO-E API a lot: how do you handle the 15-min vs hourly resolution, the gaps, and the outage endpoints? I normalised everything to hourly UTC and I’m curious what conventions others settle on.
Thanks, keen to hear where this breaks or where the approach is naive.
1 Like
Hello,
I looked at the notebook de-lu-power-signal/notebook/de_lu_nlt_backtest.ipynb at main · thomasgibson738-lab/de-lu-power-signal · GitHub with the following scatter plot. Question: is it with the real data or with the DEMO data? If it’s with the real market data, what I am reading is that:
- for high prices (>100 €/MWh), the correlation is decent for moderately high prices, but not for higher prices in the 150–400 €/MWh range
- for negative prices, there is a huge number of false positive, as shown in by the 9.3% precision rate in the notebook table. Also, the numbers in the notebook table are different from the numbers in you forum post. Is is a matter of synthetic data or of tuning?
Anyway, in the end, I just wanted to say that the last time I tried a linear regression “DA price ~ netload”, I was very disappointmented by the performance (very low R² value, don’t remember how low though…), due to the lack of strong underlying correlation.
Hey man, cheers fo the taking the time to actually read it that carefeully, and yeah sorry genuine slip up there. I’d accidentally published the demo run of the notebook (the DEMO flag was left on), which is why its table, the 9.3% negative-price precision included, didn’t match my forum post. So to answer directly: synthetic, not tuning. I’ve now corrected it, so the notebook shows the real run at the same link.
The real DE-LU figures (walk-forward, out of sample, about 3 years):
- spike-risk: 57.5% precision, 7.4x lift
- cheap/negative: 44.7% precision, 7.1x lift, ~92% recall on negative-price hours
So the real negative-price precision is 44.7%, not 9.3%, far fewer false positives than the demo suggested. (The synthetic generator also injects random price shocks unrelated to net load, which is what produced that spray of high prices at mid-tightness you noticed.)
On the linear regression, I think that’s a crucial point. price ~ netload is strongly nonlinear: roughly flat at low net load, then convex and steep once you’re up the merit order, so a linear fit gets a low R2 almost by construction, which matches what you saw. I deliberately didn’t regress. Net-load tightness is used only as a decile tail-classifier (“is this hour in the tight or loose extreme”), which targets the part of the curve where the signal is strongest and ignores the messy middle. That’s how a low global R2 and a decent tail lift can both hold. And I agree net load is one driver among several (gas, scarcity/ramping, interconnector flows, forecast error), so it flags spike/cheap risk rather than price level, especially in that 150 to 400 tail.
Thanks again.
Quick correction to my original post: I said NLT is “knowable before the market clears”. That’s wrong. ENTSO-E’s day-ahead wind and solar forecasts only have to be published by 18:00 the day before delivery (Reg. 543/2013, Art. 14.1.d), which is after the 12:00 day-ahead auction. So as built it explains price formation rather than being usable to bid. I’ve updated the README and notebook. A genuinely pre-auction version would need its own renewable forecast from weather data, which would be the interesting test.