Dear oemof collegues,
We need to optimize an electrolyser which can has two operational modes: Either it is actively producing H2 or is in stand-by mode. While it is in stand-by mode, it consumes electricity (5% of its power capacity), although no H2 is produced. We are now wondering how to model this stand-by mode.
First, we planned to model the electrolyzer as a transformer and a sink requires the exact 5% of the transformer’s power capacity. Obviously however, this would add stand-by consumption also when the plant is operating, ie. energy consumption will be overestimated.
Simulating the electrolyzer with a offset transformer (that consumes 5 % times capacity less than it would nominally do) and a sink (of 5% times capacity) could work, but as far as I know we would not be able to optimize our capacity anymore.
Has anyone faced a similar problem? Any suggestions will be of great help.
Thanks in advance.
I once modeled iron and copper losses in substation transformers for use in energy system optimization models and found some quite interesting results. My particular application was offshore wind installations with embedded substations. This sounds somewhat similar to your problem … so I’ll send you some details offline and you can determine if there is anything worth scavenging. HTH, R.
And you could introduce a binary variable for the operational state of the electrolyser to distinguish between standby and production. But that will slow down your solver considerably. Are you pushed for performance? HTH again, R.
Hi Robbie,
Thank you for the extended reply. As out application has to optimize the system rather quickly, we do not think a binary variable is a good option (still, we might try it out in case we don’t have a better idea). Your offshore wind application could work for us provided that the iron and copper losses are only produced when the system is not operating. If that is so, your information would be of great help for us.
Meanwhile, we have defined in greater detail the idea of modelling the electrolyser with a transformer and a sink. We have thought of coding an oemof constraint that forces either the transformer or the sink to consume the 5% electricity required in stand-by mode:
Sink(Stand-by losses)(t) + Inflow(Electrolyzer)(t) - CAP(Electrolyzer)*5% >= 0
Theoretically, this sink is intended to consume no electricity except for when the electrolyser is not producing any H2. In part, this idea works out, but sometimes it happens that the 5% are at least partly fulfilled by running the electrolyzer itself, as there is no incentive to feed the sink.
Some figures are added to complement the explanation:
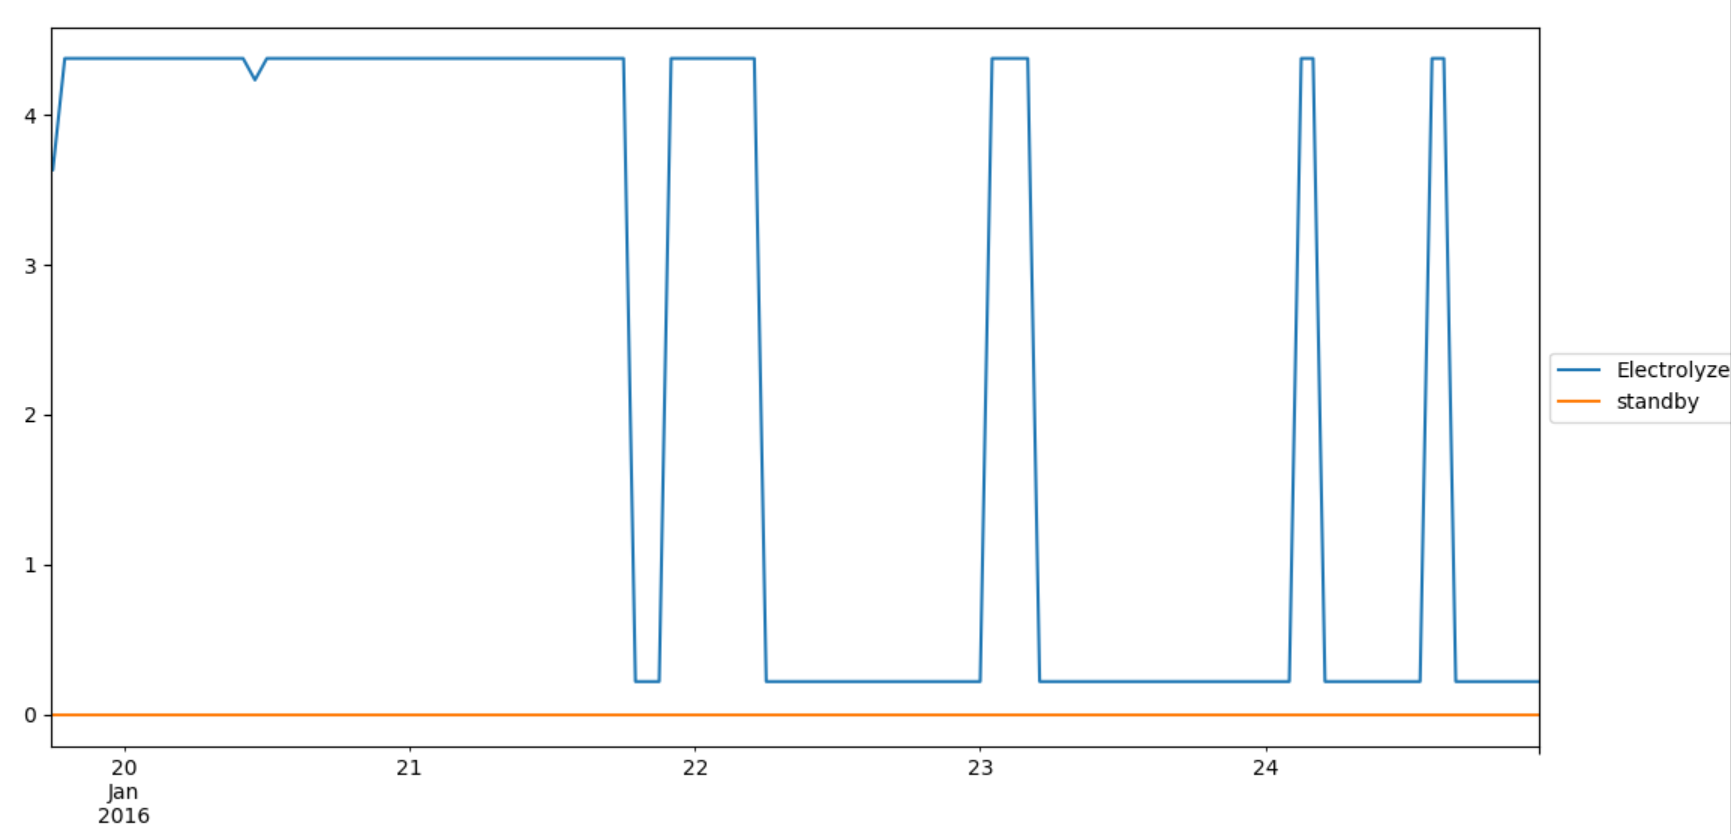
First of all, we tried the constraint as written in last comment (see code)
As commented however, with this basic constraint there is no incentive to feed the sink. Therefore, the 5% constraint is obtained with the transformer itself, which is not desired (see graph)
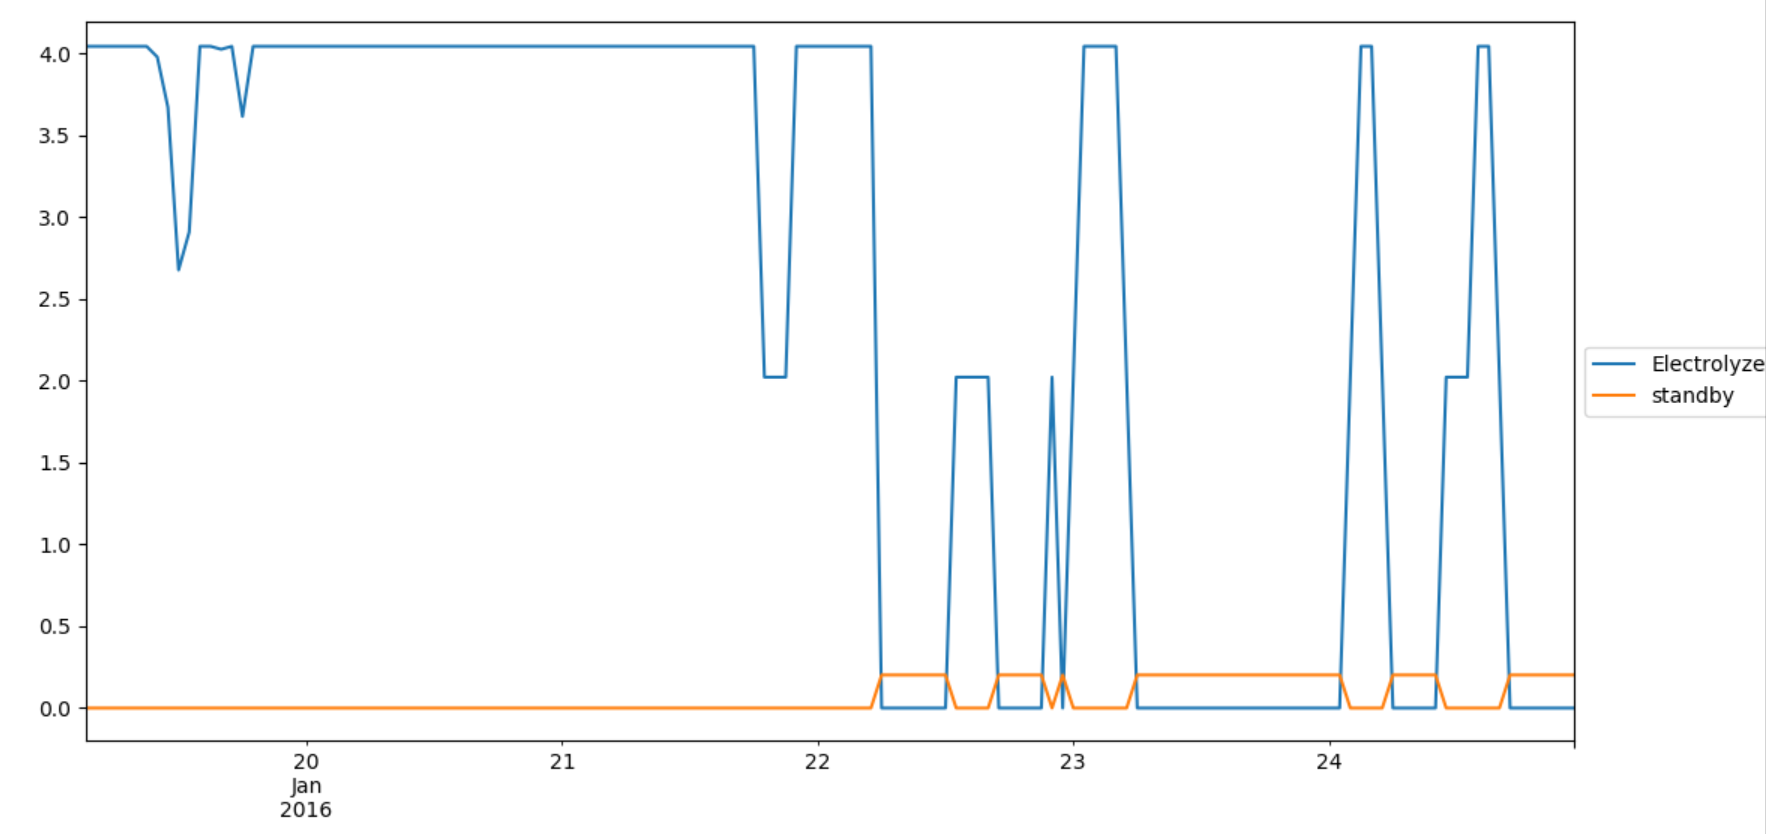
Then, we have tried to force the sink to be feeded modifying the weights of each flow in the constraint. That was done by dividing the inflow to the transformer by 10 (see modified code below)
This unbalanced equation achieves in the majority of cases the behaviour we want (see graph), although it is definately not elegant. And we don’t know for the moment if we are affecting the results somehow.
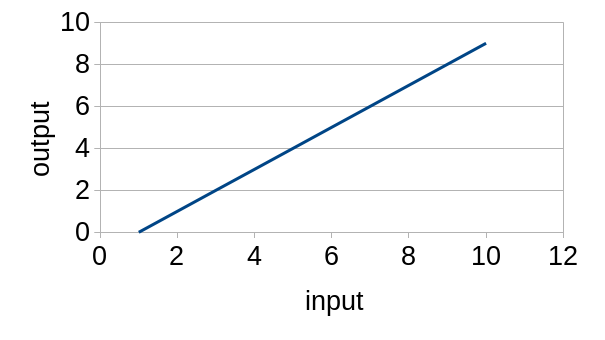
I do not totally understand what behavior you want to have for your transformer. Is this what you want?
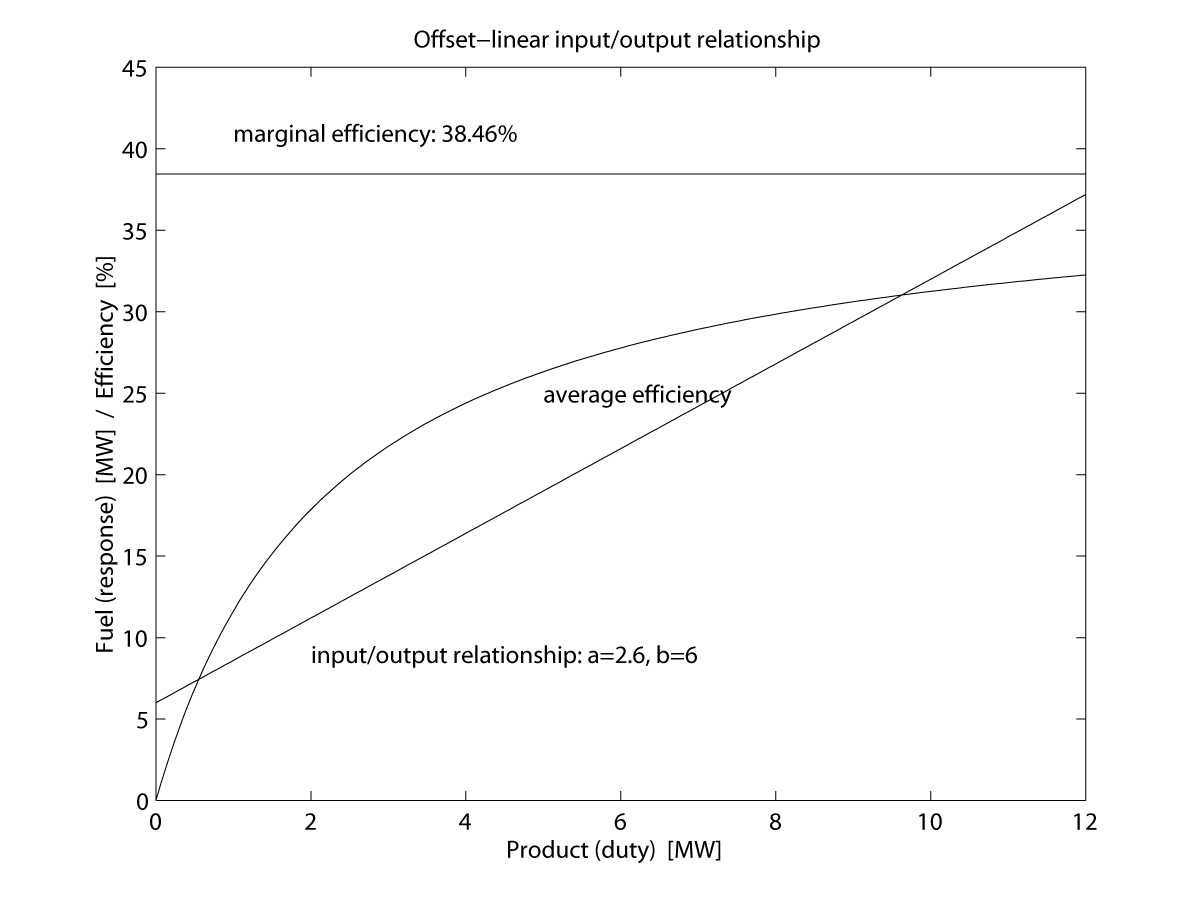
I usually draw the axes the other way around. Here is an arbitrary example showing average and marginal efficiencies (those matlab plots were just the cats whiskers back then):
And the following two page PDF (from 2005) contains the same idea with auxiliary losses (faux), no‑load losses (f0), a minimum duty (pmin), and a maximum duty (pmax). Also an explanation, more plots, and the mixed‑integer formulations:
deeco-milp-shutdown.pdf (141.6 KB)
I have an implementation in C++ and also calibrated to an industrial gas turbine unit. The fit to the manufacturers characteristic curve was remarkably good. The source will be on GitHub in due course, otherwise DM me for the files in the interim. HTH, R.
In the first step I would like to make the problem less (!) complicated. I just want to know which behavior of the component is intended. In a second step we can discuss how to model it with LP or MILP if necessary.