Matching ENTSO-E Production Type and Eurostat SIEC data categories

Hi!

Does anyone know if there is a best practice on how to match the categories used by ENTSO-E for different production types / energy carriers (see here, examples are Biomass, Fossil Gas) and those used in the Eurostat SIEC classification scheme (see here, examples are Bioenergy, Natural Gas)?

Two studies that touch on this topic that I am aware of are by Wörner et al., 2019 (in German) and Unnewehr et al., 2022. However, Wörner matches ENTSO-E with AGEB/Destatis data, not with Eurostat data (Bild 1/section 3.2). Admitteldy, the categories are quite similar for Eurostat and AGE. Unnewehr describes the matching process in section 3.4, but not in detail for every single category.

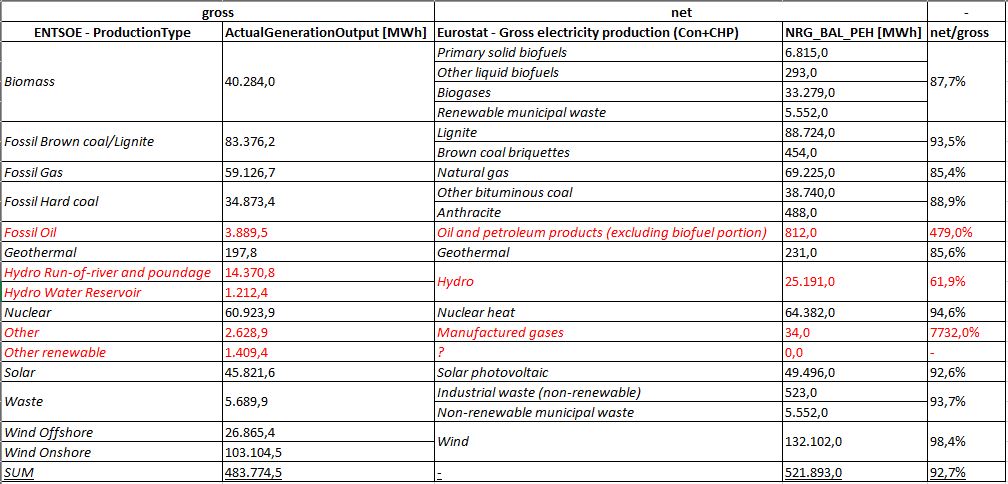
The ENTSO-E categories I am still most uncertain about how to match them with Eurostat data are Fossil Gas, Fossil Oil, Fossil Coal-derived gas, Other, Other renewable and Waste. Should I match Refinery Gas (Eurostat) with Fossil Oil (ENTSO-E), or another category? Renewable municipal waste could match with Other renewable, but also with Waste. Finally, how to best deal with the fact that natural gas powered CHP plants appear to be listed in the category Other, not Fossil Gas as one might expect (according to Wörner, Bild 1/section 3.2 - not sure if this is still the case)?

With the studies cited above, I could probably make a best guess for matching the two classification schemes. But perhaps there are official or semi-official studies / guidelines on how to do it “right” that I missed so far. Any help is greatly appreciated!

Best,
Malte

1 Like

Dear Malte,
this is one of our main use cases for the OEO. We label this as “sector division” concepts.
see: https://openenergy-platform.org/ontology/oeo/OEO_00000368
Currently only the CRF is released yet. But there are a lot of concepts the dev-team is working on.
Issues · OpenEnergyPlatform/ontology · GitHub

By adding these to the ontology it will be possible to compare across all systems.
Because this will take a little while we would be glad if you make your result availlable.

2 Likes

Hi Ludwig,

Thank you for the quick and encouraging response. I’ll be happy to share my results on how I matched the two sets of categories, and the logic behind it. I’ll keep you posted!

Best,
Malte

Hi everyone,

Here a preliminary result from my attempt at matching. I used data for 2020 for Germany, from ENTSOE (Actual Generation per Production Type), and from Eurostat (NRG_BAL_PEH).

Note that ENTSOE data refers to net generation (without power plant autoconsumption), and Eurostat data to gross generation (with autoconsumption). Therefore we expect the ENTSOE values to be smaller.

I summed up the ENTSOE values for the whole year (35136 values, 15 min intervals), aggregated by Production Type. I summed up the Eurostat values for gross electricity production both from CHP- and non-CHP generators, limited to main-activity producers (MAP). This means I assume that the ENTSOE data only contains MAP (please correct me if I’m wrong here).

The results are shown in this screenshot (.xlsx file can be found in the attached ZIP folder):

I’ll try to describe the logic briefly that I used for matching the categories. The main goal was that the names matched up, and that the ENTSOE (net) values are smaller than the Eurostat (gross) values. This was fairly straight forward for most categories (Fossil Brown coal/Lignite, Fossil Gas, Fossil Hard coal, Geothermal, Nuclear, Solar, Wind Offshore and Wind Onshore).

I further assumed that Renewable municipal waste is included in Biomass (along with the other three categories that also seem to be straight-forward). The reason for that is that without Renewable municipal waste, the net/gross ratio seems fairly high, while matching Renewable municipal waste with Other renewable leads to a very low net/gross estimate in that category.

I marked in red those categories where I’m still unhappy with the matching. For Fossil Oil, the net/gross ratio is >> 1 (479 %), so something must be wrong here. For Hydro […], the ratio is fairly low (61.9 %). It could be that pumped hydro should be included here, but then the ratio is slightly > 1 (103.8 %). Other also has a ratio of >>1 (7732 %), so the same applies as for Fossil Oil. Finally, my matching leaves no Eurostat category that can be matched with the ENTSOE category Other renewable (ratio =0).

If someone has any ideas for improving the matching, I’d be happy if they were to share them here. If I had more time to dedicate to this issue, I would use data from other years and countries and try and match them. I included the screenshot above, the .xlsx file containing my calculation results, and the Jupyter notebook I used for working with the ENTSOE data, as well as the Eurostat input data file (.xlsx) in the ZIP file attached to this post - perhaps others may find this useful.

Cheers
Malte
entsoe_eurostat_match.zip (105.1 KB)

3 Likes

Hi @MalteSchaefer

As per EU 543/2013 article 16.1.A, operators should publish

actual generation output (MW) per market time unit and
per generation unit of 100 MW or more installed
generation capacity

But currently pumping is included as negative values in ENTSOE data.

I see that pumped storage generators are currently splitted in two in ENTSOE registry, one generation unit and one storage unit (when pumping). (see 17W0000014356564 and 17W100P100P0082H which correspond to the same physical machine). It’s a really poor idea.
We can guess things could change in the future due to this distinction but I still think pumping should be count as negative production.