Hello everyone,
I’m looking for building contours for Saxony-Anhalt (3 Landkreise) to calculate the PV potential.
There’re data sources such as the official contours (“Hausumringe”) [1] and the digital landscape model BasisDLM [2] but none of these data are open.
Possible solutions I see:
- Buildings from OpenStreetMap: Great, but the coverage, especially in rural areas, is quite poor
- Extraction by color using WMS services from public raster maps, e.g.
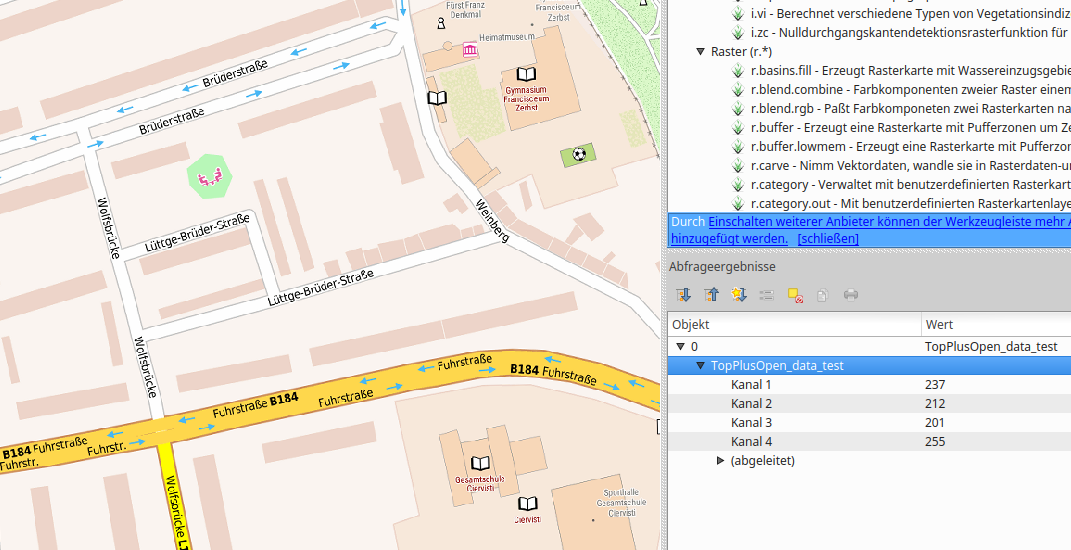
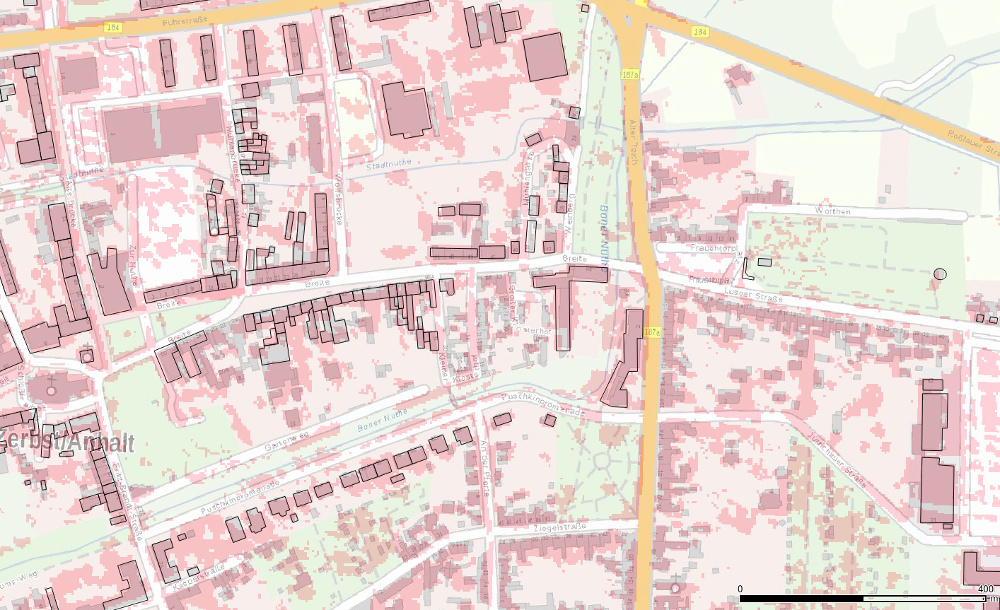
2a) TopPlusOpen [3] (German BKG)
Works well, since buildings feature a defined color, but many buildings are missing here:
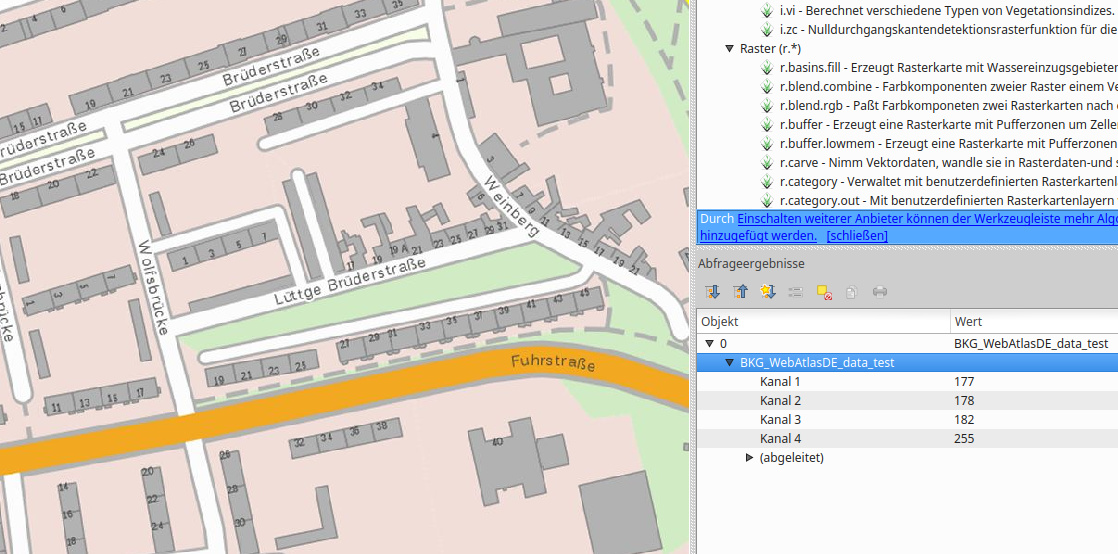
2b) WebAtlasDE [4] (vom BKG):
Apparently all buildings are included but it doesn’t work well as there’re overlain by captions and the color is not unique:
Do you have ideas/different approaches?
Do you know where to find appropriate maps/data sources that allow to implement the solution in 2)?
Best,
Jonathan
[1] https://www.lvermgeo.sachsen-anhalt.de/de/hausumringe.html
[2] https://www.gfds.sachsen-anhalt.de/ows/de/basis-dlm-lsa/basis-dlm-digitales-basis-landschaftsmodell.html
[3] http://www.geodatenzentrum.de/geodaten/gdz_rahmen.gdz_div?gdz_spr=deu&gdz_akt_zeile=5&gdz_anz_zeile=1&gdz_unt_zeile=41&gdz_user_id=0
[4] http://www.geodatenzentrum.de/geodaten/gdz_rahmen.gdz_div?gdz_spr=deu&gdz_akt_zeile=4&gdz_anz_zeile=4&gdz_unt_zeile=0&gdz_user_id=0
To remove noise and artifacts, I converted the colors to a reduced palette, this allows masking by color, but you still have to remove non-building-objects with same colors (e.g. street margins). It’s possible to clip the raster with OSM data to remove e.g. streets. However, there’re more objects such as captions which cannot be deleted easily (might be done with OCR)…
Some advanced approaches are
- to perform spectral analysis -> automatic classification (e.g. with QGIS Semi-Automatic Classification Plugin). I trained the software with building shapes but it did not produce sufficient results - here I got similar problems with colors.
- to train some machine learning software on pattern recognition…wait, what?
This is what actually happens when data is not open 
(I still hope there’re more data out there…hints?)
The European Settlement Map may be of help for you. It identifies buildings based on satellite images with a resolution of 2.5m for all Europe. It is neither as precise nor as accurate as a local analysis would be, but it may still be worthwhile to check.
https://land.copernicus.eu/pan-european/GHSL/european-settlement-map/
Thank you, Tim!
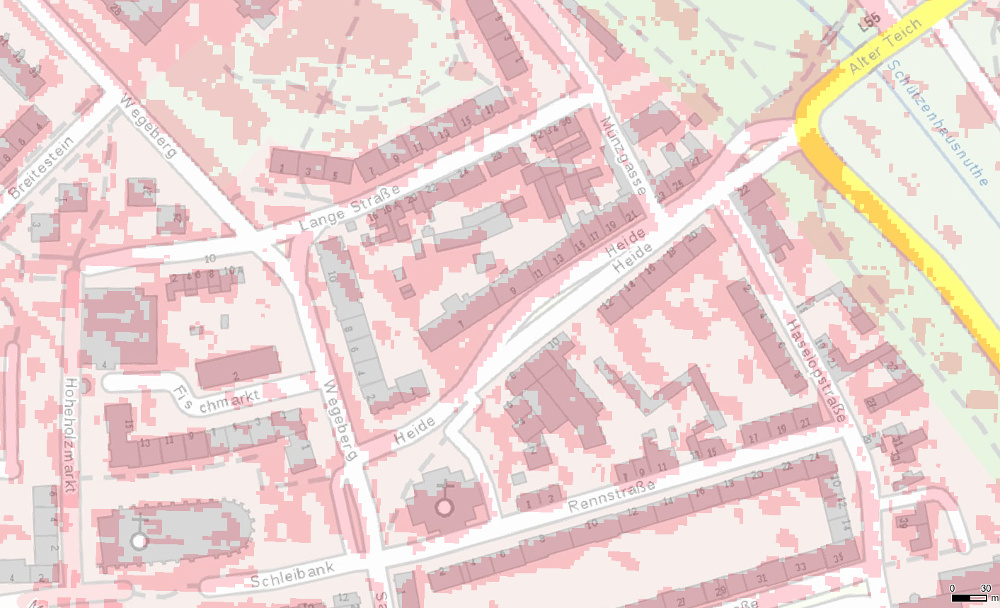
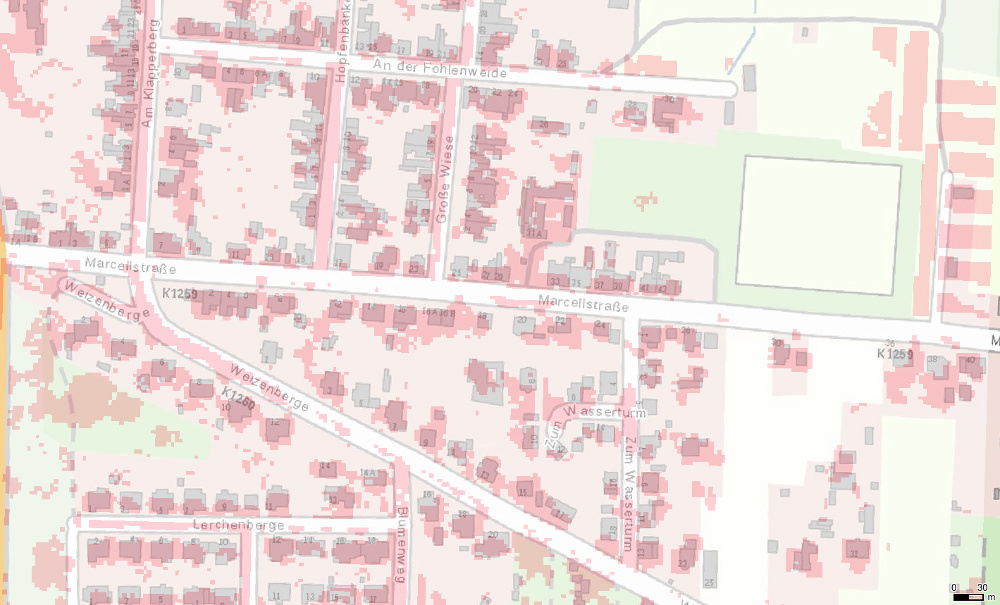
Firstly, 2.5m resolution are not that bad (btw: the contours data above come with an accuracy of +/- 3m). I checked the ESM and the biggest problem (at least for my application) seems to be the classification, not the resolution. The following pictures show WebAtlasDE with ESM overlay (building class only according to docs, sec 6.1.1)
The ESM roughly overlaps buildings. Presumed that the building data from WebAtlasDE is correct (btw: it corresponds almost perfectly with satellite and aerial imagery), it shows a lot of misclassifications including locations where there’s no building at all.
Similar to the idea above, the error could be reduced by excluding streets, yards etc. (e.g. using OSM) but the mismatch still seems way too large to me (and I can hardly evaluate how large)…
Agreed that the map is too coarse to derive building contours for your case. It’s probably more useful for statistical analyses. The classification is done automatically and so the result is in any case worse than anything that is done manually. I still thought the quality would be higher, in particular because OSM data is used to support the detection.
Hmm, not sure how they’ve used it to support the detection…
Example (black outlines are building shapes from OSM (today)):
I checked some of the OSM building objects and even the ESM data for those which have been added to OSM long time (7a) ago (and consequently should have been used in ESM) do not show better results than recently added ones.