I’ve been working for the past days on calibrating amiris for the spanish and portuguese electricity market, MIBEL, with the intention of implementing a few RES policies afterwards to check the effects on prices and energy mix. Currently Spain doesnt have any type of market based RES policy implemented, so it’s a relatively straightforward process. For the RE profiles, i dowloaded the data from REE and it’s API (both real production and installed capacity). For prices, i actually used the same oil and coal prices as in the Germany 2019 example, given the fact that this prices are, as far as i’m aware, the same across the Internal Market. For gas, i’ve dowloaded the data from CNMC (Comisión Nacional de Mercados y Competencia).
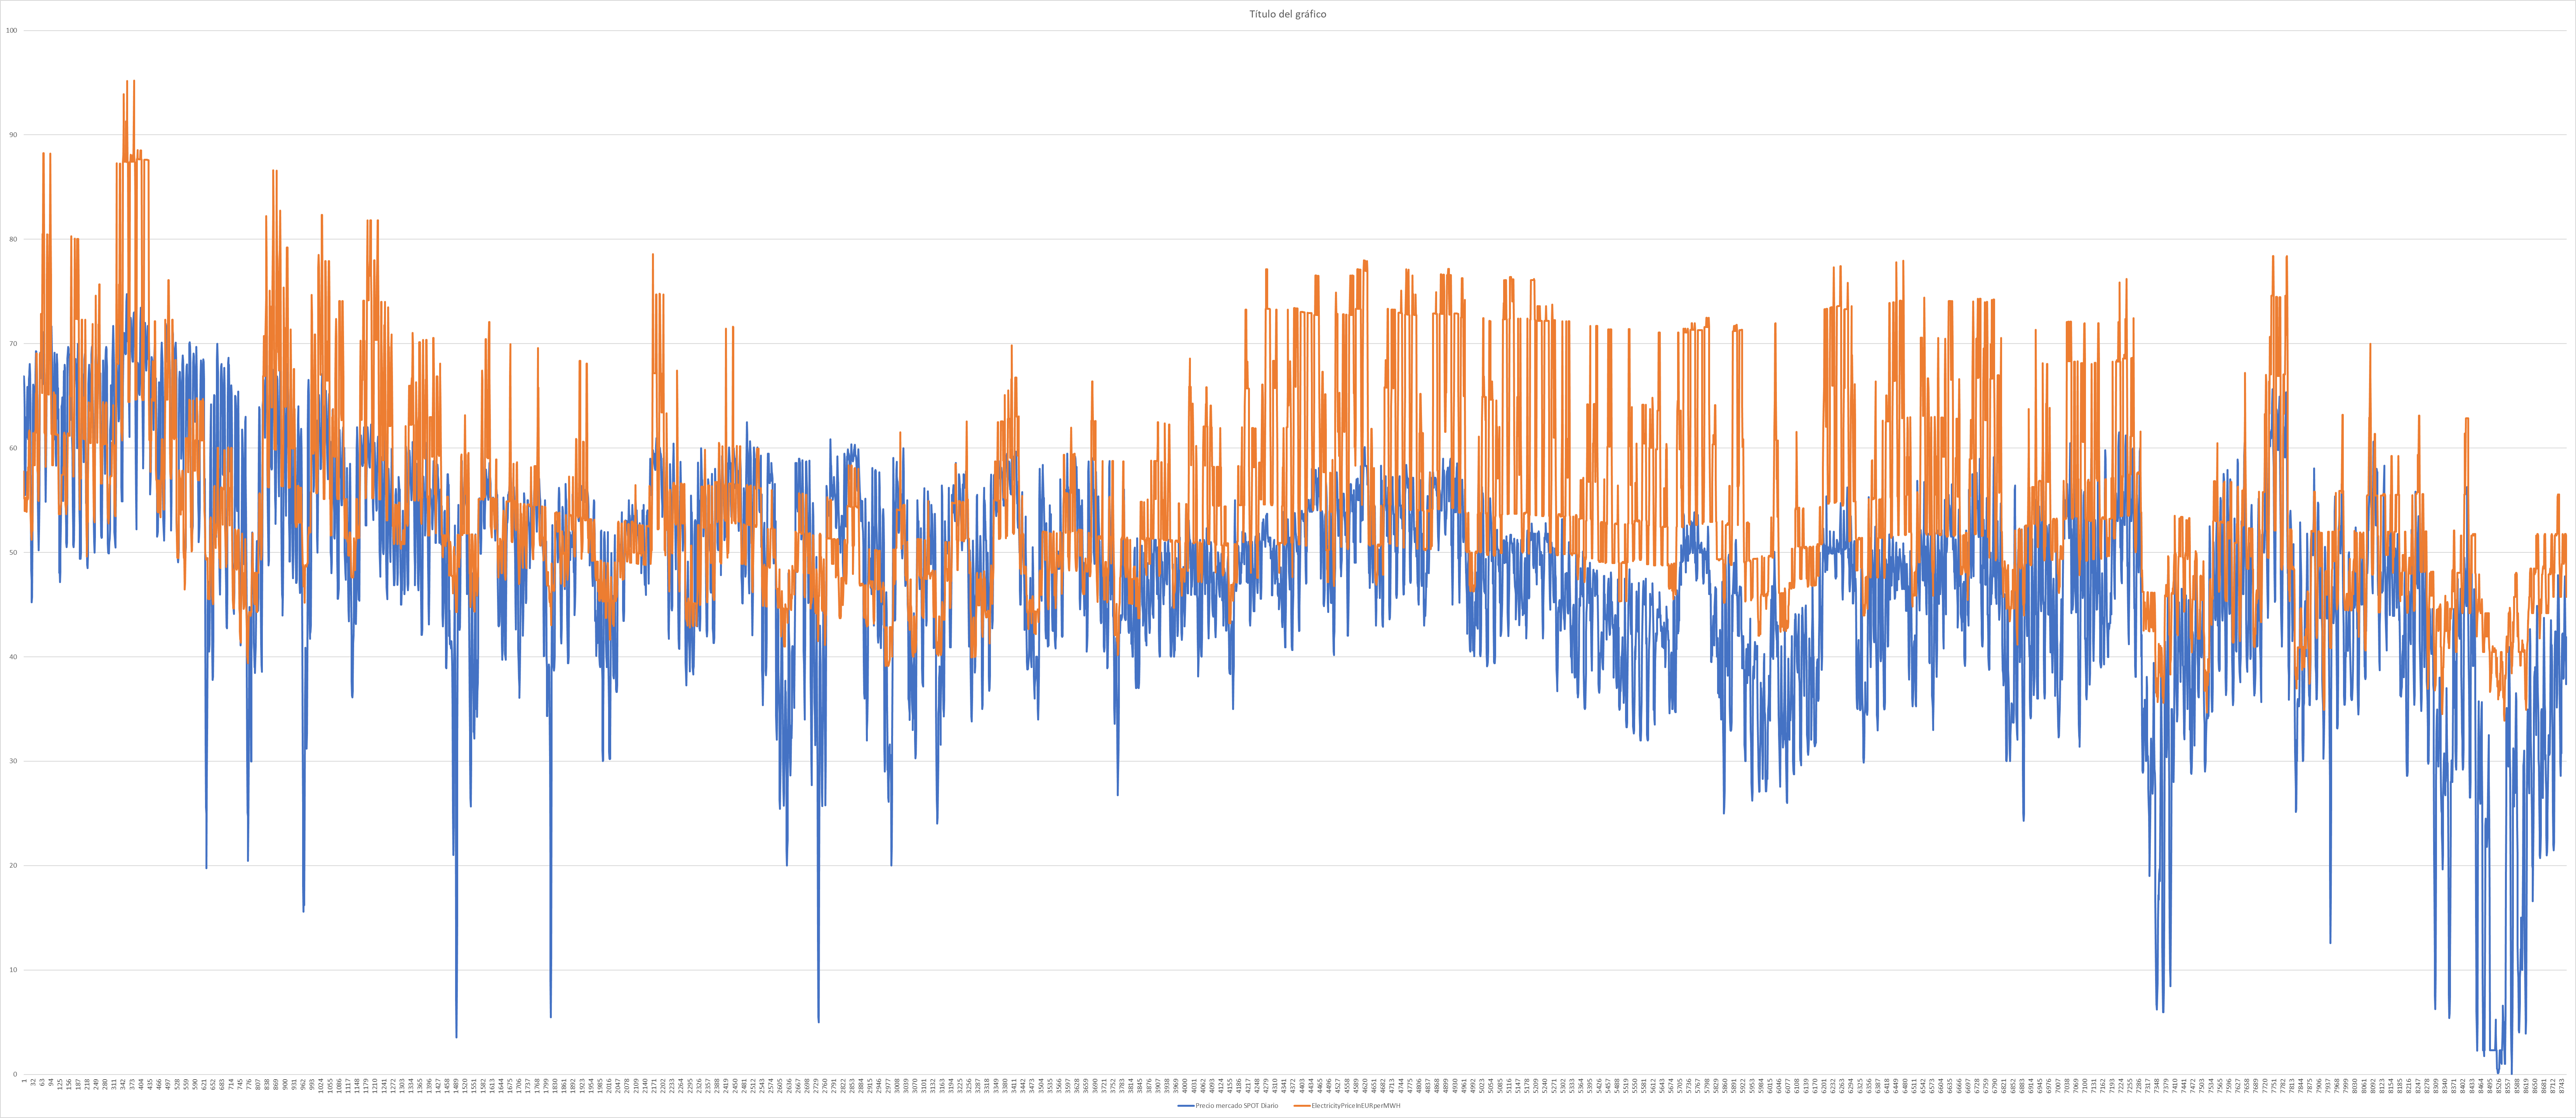
The results of the simulation for 2019 are the following:
Where in orange you can see AMIRIS prices, and in blue the actual prices for that year. My main issue and reason to write this post is that i find some discrepancies wich have to be errors from the calibration process, mainly that prices tend to be higuer overall in summer than what they should be, and there are weird price spikes at certain points of the year that i dont know how to explain. Nonetheless i think i captured the overall tendencies of the real prices.
Please, let me know what’s your opinion on this issue, i would like to make the model as accurate as possible. Thanks in advance!
thanks for sharing your work. There might be a few things that can cause this discrepancy. A few ideas that sprint to my mind:
How did you consider imports and exports? We usually subtract them from the domestic demand.
Are there additional renewable feed-ins in MIBEL, e.g. technologies that we disregarded in Germany, like, run-of-river, biomass or so?
How did you configure the conventional powerplant park? What data did you use for them? Maybe you are missing a type of powerplant, e.g. nuclear or waste?
How did you adjust the markups of the conventional traders?
Imports and exports have been considered for this model. MIBEL as little interconexions with Morocco and France, nonetheless i’ve substracted the measured interchange to the real demand. The results are quite similar, altough i have some weird spikes of negative prices.
Following with the next question, i tried to take in to account all possible energy sources in Spain. i removed lignite and added a new 2000Mw source for thermal solar, modeled as a fake “nuclear” source to give it the lowest possible price for fuel, plus added cogeneration to the mix with gas as the fuel source and with reduced efficiency. For Renewables, Spain mainly works with Hidro and Wind-On-shore, so i removed wind-off, adjusted the size of the average energy unit to take that in to account. alternative energy sources like biogas are negligible, with around 200Mw installed, and they usually represent 0,1 percent of the mix at best, so i disregarded them for the shake of simplicity.
As per how i configured the conventional park, as i found out most conventional plants in Spain are relatively modern and built on similar time periods. Coal generation is negligible, and the same can be said about diesel turbines, with the main sources beeing gas (Combined cycle and regular turbine) so i’ve asumed that efficiency should be similar to those found on Germany. As per the nuclear energy, i found from a report by the IEA that all reactor belong to the same type, so i just needed to find the average efficiency of that technology, wich i’ve got from another report from the US department of Energy.
I actually did not change the markups, due to this beeing my first iteration of the calibrated model and lacking the expertise to calibrate that. Could you please send me suggestions on how to calibrate this?
My main issue is looking for sources to find all this information. As far as i’m aware, Spain doesnt have a public portal to find energy sources arquetipes or standards, Sadly.
Yes, exactly. When i started working with AMIRIS i wrote to the developer team, and in the answer they mentioned, if i recall correctly, that Germany as a set of standards or arquetypes for electric power plants, as in " the representative nuclear plant has this predefined characteristics", for example. I guess that this exist to bether inform policy makers and has benchmarks to compare new power plants. Spain, sadly, lacks this kind of source as far as i’m aware off, or at least is not easily available for the public.
In other order of things, i’ve noticed i had left out to calibrate “Other” renewable sources, which amounts for 800-1000Mw/h of installed capacity, and is used at around 45% all year long. One question i have is, what values should i use for installed capacity? The ones at the beggining of the year, or the ones at the end of it?
For the RES profiles, i used the monthly installed capacity data to get the percentage. So, for example, in January for solar i have 4829Mw, while by the end of the year it has almost doubled, at 8746. So, if the RES profile indicates a value of .5, in an hour in august it varies wildly between using January and December values. Maybe i should use the average installed capacity for that year instead?
my suggestion is: use the upper value for the installed capacity and re-scale your yieldProfiles to match that value. So: Just divide the actual “measured” feed-in from your sources by the installed capacity you go for in the scenario and then you have a matching yieldProfile. Also, you can add other fixed feedins that you do not want to model in detail, by using a VariableRenewableOperator with energyCarrier “other” contracted to a “noSupportTrader”. Have a look at the AMIRIS Germany example, where we use this for the agents with id 53 & 12.
Hello, I would like to provide a brief update on my progress, and also have a question regarding FIT modelling. By adjusting the markup values and incorporating exports and imports into the demand and modifying the RES profiles as suggested, I succeeded in obtaining a good model. It matches the average prices through 2019 with precision in the decimal range. Not only that, but the energy mix is also a reliable representation of historical data. Occasionally, I observe unusual negative prices at certain times of the year. My assumption is that the model is overreacting to an external shock (which appears to be relatively common in Mibel, as depicted in the previous charts).
I have a question about selecting the Feed-In-Tariff (FIT) value. As far as I am aware, this price is typically determined by estimating the production costs specific to the supported technology, as well as its social benefits, i.e. total social welfare. How did you estimate these values for the German model?
I’ve also managed to implement a FIT policy for hydro, solar and wind. However, I cannot see any change in prices or energy mix, although I can see the support received through SystemOperatorTrader. Is this the intended behaviour or have I made a configuration error with the support policy?
it is good to hear you are making progress. The FIT as we implemented it has a priority feed-in. Thus, SystemOperatorTrader will bid at minimum prices (i.e. -500€/MWh). The prices you observe most likely stem from negative bids of conventional plants with mark downs. If you send me your scenario and contracts, I can have a look at your configuration and see if I spot any errors.
Please, keep in mind that this is based on your Germany2019 example, so many of your anotations and sources are still there, most of them will be removed when the model is no longer WIP. Furthermore, there are some spanish anotations but those are not relevant, just some sources on prices, etc…
thanks for sending your inputs. I’ve checked them and your scenarios and contracts seem just fine - nice! I ran them and compared results and spotted some minor differences between your Baseline and FIT scenarios.
Prices:
In Baseline, minimum prices are 0, 1 and 1.2 - which match the renewable OPEX and thus that is when renewables without support become price setting (bid=OPEX).
In FIT scenario, minimum prices are negative, as renewables now take priority feed-in (bid=-500) and thus the prices at around -130€ stem from markdowns of conventional power plants
Other differences in FIT scenario compared to baseline:
Storage has 3% more dispatch
Conventionals have 0.1% less dispatch
Renewables receive about double the money: The are now payed a constant FIT for every produced MWh regardless of the market price - whereas in Baseline, they only receive the market revenues.
Regarding the price spikes in general: The Storage could contribute to avoid price spikes - and I see that your storage does seldomly dispatch with full power and you reduced the storage charging efficiency. Maybe double check on the efficiency estimate of the installed plants in Spain and this might remove your spikes.
Calibration of FIT: Since we have a FIT in German legislation, we used the actual tariffs as described there. So I have no suggestion here on how to calibrate the FIT in your case.
I wanted to ask, what’s your methodology for analysing AMIRIS outputs? At the moment I have a “master” Excel file where I enter the data series I’m interested in, but this is time consuming and I was wondering if there was a better way to look for differences between my different scenarios, since i have to analyse another two (FIP-Variable and FIP-fixed)
we use Python for automated analysis. Usually, we load the output files of AMIRIS to Dataframes using pandas.read_csv and then calculate derived values by operating on the Dataframes.
Hi! Just wanted to let you know that I’ve already finished my thesis, which without your help could not have been done properly. So I wanted to express my gratitude for all the help, either through this forum or by direct e-mail, and I also would like to share my thesis here because it might be an interesting read and it might help other people in a situation similar to mine.